PGNiG on the Stock Market
In 2013, the PGNiG share price hit an all-time high of PLN 6.55. Having delivered solid financial performance, the Company was able to pay a dividend and carry out major investment projects. However, 2013 was also a time of stock market volatility. At the end of the year, the PGNiG share price was close to that at the end of 2012.
Our position on the Warsaw Stock Exchange
From the day PGNiG shares were first listed on the Warsaw Stock Exchange (September 23rd 2005), they have been among the most recognisable and credible listed securities. They have been included in the WIG20 blue-chip index since December 15th 2005, as well as in the MSCI Emerging Markets Index, a global index of emerging market stocks put together by Morgan Stanley Capital International.
We are also proud that PGNiG has been included in the RESPECT Index of socially responsible companies since its inception. 2013 was the seventh year of the index’s existence and PGNiG’s inclusion in it. In 2013, the Warsaw Stock Exchange launched the WIG30 index, comprising Poland’s 30 largest listed companies. First quoted on September 23rd 2013, the new index will ultimately take over the role of the WIG20. PGNiG shares are also included in the WIG Paliwa index of fuel sector companies, accounting for 34% of its portfolio (at the end of 2013).
Performance of the PGNiG stock
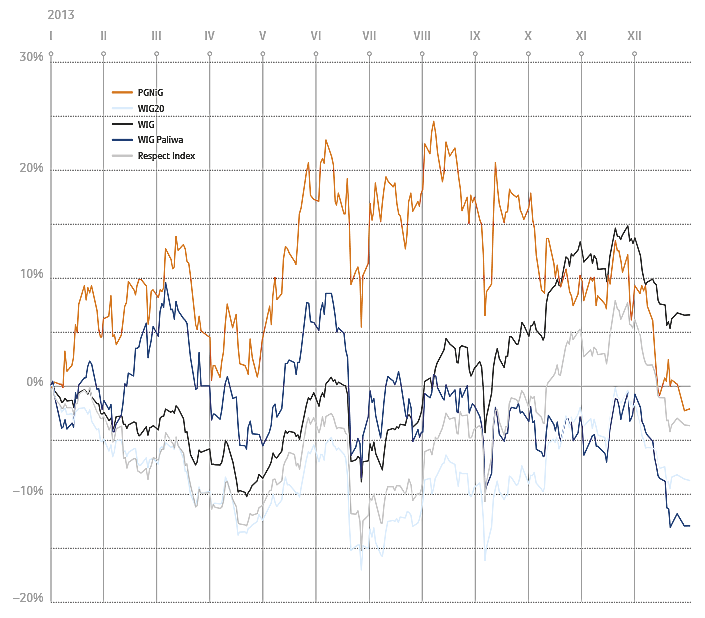
Over 2013, the PGNiG stock traded within the PLN 5.14–PLN 6.55 range (compared with PLN 3.62–PLN 5.21 in 2012). The first half of 2013 Saw a strong rise in the PGNiG stock price, which was also accompanied by high price volatility. The all-time high of PLN 6.55 was reached in August. From that peak, the PGNiG share price entered a declining trend and closed year-end at PLN 5.15. The trend reversed on the back of macroeconomic changes (such as monetary policy tightening by the US Federal Reserve) and regulatory developments in Poland (announcement of changes relating to open-end pension funds, requirement to sell a pre-defined amount of gas through the power exchange). Another contributing factor was investor pressure on profit taking, while PGNiG had to face growing challenges posed in particular by the gas market deregulation.
In 2013 alone, the return on investment in PGNiG shares was 1.3% (including dividend yield). Over the year, the return on investment in stocks included in the WIG20 index was -7%, WIG Paliwa shrank by 10%, whereas the WIG total return index went up by 8%. Net of dividend yield, the return on investment in PGNiG shares in 2013 was negative at -1.2%. Since the IPO of September 23rd 2005, the return on PGNiG shares (net of dividend yield) has exceeded 35%, far outperforming the WIG20 benchmark index, which has posted a loss of -2%. The return on the WIG index, which reflects the entire main market of the Warsaw Stock Exchange, has reached 54% in the same period.
Performance of WSE indices and the PGNiG stock
| Index | Value/price as at Dec 28 2012 | 2013 high | 2013 low | Value/price as at Dec 30 2013 | PGNiG’s weight in WSE indices as at Dec 30 2013 |
|---|---|---|---|---|---|
| WIG | 47,460.59 points | 55,246.4 points | 43,159.57 points | 51,284.25 points | 3.0% |
| WIG20 | 2,582.98 points | 2,628.36 points | 2,177.02 points | 2,400.98 points | 4.7% |
| WIG-Paliwa | 3,571.11 points | 4,048.79 points | 3,206.98 points | 3,215.11 points | 34.2% |
| Respect Index | 2,591.15 points | 2,854.54 points | 2,250.8 points | 2,559.17 points | 9.3% |
| PGNiG | 5.21 PLN | 6.55 PLN | 5.14 PLN | 5.15 PLN | - |
| Source: gpwinfostrefa.pl | |||||
Rates of return on WSE indices and the PGNiG stock in 2010–2013, and total return since PGNiG’s IPO
| Rate of return in 2010 | Rate of return in 2011 | Rate of return in 2012 | Rate of return in 2013 | Rate of return since PGNiG’s IPO | |
|---|---|---|---|---|---|
| WIG | 18.8% | −20.8% | 23.8% | 8.1% | 54.4% |
| WIG20 | 14.9% | −21.8% | 17.7% | −7% | −2.3% |
| WIG-Paliwa | 26.4% | −18.5% | 34.8% | −10% | –9.7% (1) |
| Respect Index | 32.2% | −12.9% | 27.6% | −1.2% | 155.9% (2) |
| PGNiG | −5.8% | 14.3% | 27.7% | −1.2% | 35.2% (3) |
| Source: the WSE |
(1) Computed in relation to the reference value of the index (reference date: December 31st 2005).
(2) Computed in relation to the reference value of the index (reference date: December 31st 2008).
(3) In relation to the issue price of PLN 2.98, the rate of return on PGNiG shares since the IPO stands at 72.8%.
Performance of the PGNiG stock
Shareholder structure
As at December 31st 2013, the share capital of PGNiG stood at PLN 5,900,000,000, and comprised 5,900,000,000 shares, with a par value of PLN 1 per share. The shares of all series, that is Series A, A1 and B, were ordinary bearer shares, each conferring the right to one vote at the General Meeting.
The State Treasury remains PGNiG’s majority shareholder. On June 26th 2008, the Minister of State Treasury disposed of one PGNiG share on general terms, which − pursuant to the Commercialisation and Privatisation Act of 1996 − triggered the eligible employees’ rights to acquire, free of charge, a total of up to 750,000,000 PGNiG shares. The start date for executing agreements on acquisition of free Company shares was April 6th 2009. The eligible employees’ rights to acquire free PGNiG shares expired on October 1st 2010.
By December 31st 2013, nearly 60,000 eligible employees had acquired 728,259,522 shares, conferring the right to 12.34% of the total vote. Consequently, the State Treasury’s interest in PGNiG amounted to 72.40%. The free Company shares acquired by eligible employees were locked up until July 1st 2010, while trading in free shares acquired by members of the Company’s Management Board was restricted until July 1st 2011.
As at the dividend record date (July 20th 2013), the ten largest institutional investors in PGNiG, apart from the State Treasury, included Polish pension and investment funds. Its major foreign investors included sovereign wealth funds, pension funds and investment funds, mainly exchange-traded funds. The objective of exchange-traded funds is to automatically track their reference stock index, e.g. an index of the Polish market or an index of developing countries. PGNiG’s institutional shareholder base comprises investors from 44 countries.
Shareholder structure in 2012–2013
| Shareholder | Number of shares/votes attached to the shares as at Dec 31 2012 | Percentage of share capital/total vote at the GM as at Dec 31 2012 | Number of shares/votes attached to the shares as at Dec 31 2013 | Percentage of share capital/total vote at the GM as at Dec 31 2013 |
|---|---|---|---|---|
| State Treasury | 4,271,810,954 | 72.4% | 4,271,740,477 | 72.4% |
| Other shareholders | 1,628,189,046 | 27.6% | 1,628,259,523 | 27.6% |
| Total | 5,900,000,000 | 100.00% | 5,900,000,000 | 100.00% |
Substantial holdings of PGNiG shares are included in the portfolios of open-end pension funds. As at the end of 2013, these long-term investors held almost 10% of PGNiG’s equity, valued at just under PLN 3 bn. This means that the number of PGNiG shares held by these funds rose by 7%. The funds with the largest equity interests in PGNiG were those which manage the largest portfolios of future pensions, that is ING, Aviva and PZU Złota Jesień. The share of open-end pension funds in the PGNiG shareholder base has risen significantly from the IPO in 2005, when it accounted for 3.5% of the share capital (valued at PLN 711 m).
PGNiG shares in the portfolios of open-end pension funds
| No. | Fund | Value/price as at Dec 31 2013 | Number of shares as at Dec 31 2013 | Equity interest | Value/price as at Dec 31 2012 | Number of shares as at Dec 31 2012 | Equity interest | Change 2013/2012 |
|---|---|---|---|---|---|---|---|---|
| 1 | ING NATIONALE NEDERLANDEN OFE | 592,480,000 | 114,277,117 | 1.94% | 671,009,587 | 128,792,627 | 2.18% | −11% |
| 2 | AVIVA OFE | 681,130,000 | 131,374,964 | 2.23% | 593,151,534 | 113,848,663 | 1.93% | 15% |
| 3 | OFE PZU ZŁOTA JESIEŃ | 550,250,000 | 106,131,801 | 1.80% | 530,368,190 | 101,798,117 | 1.73% | 4% |
| 4 | AMPLICO OFE | 236,780,000 | 45,669,746 | 0.77% | 234,536,533 | 45,016,609 | 0.76% | 1% |
| 5 | AXA OFE | 211,990,000 | 40,888,513 | 0.69% | 213,325,195 | 40,945,335 | 0.69% | 0% |
| 6 | AEGON OFE | 110,480,000 | 21,318,817 | 0.36% | 100,016,193 | 19,196,966 | 0.33% | 11% |
| 7 | NORDEA OFE | 128,390,000 | 24,763,114 | 0.42% | 102,827,332 | 19,736,532 | 0.33% | 25% |
| 8 | ALLIANZ POLSKA OFE | 104,710,000 | 20,195,933 | 0.34% | 89,965,175 | 17,267,788 | 0.29% | 17% |
| 9 | GENERALI OFE | 113,500,000 | 21,892,422 | 0.37% | 71,407,072 | 13,705,772 | 0.23% | 60% |
| 10 | BANKOWY OFE | 105,740,000 | 20,395,586 | 0.35% | 77,013,465 | 14,781,855 | 0.25% | 38% |
| 11 | OFE POCZTYLION | 61,860,000 | 11,931,129 | 0.20% | 41,785,242 | 8,020,200 | 0.14% | 49% |
| 12 | PEKAO OFE | 53,730,000 | 10,364,315 | 0.18% | 38,752,027 | 7,438,009 | 0.13% | 39% |
| 13 | OFE WARTA | 36,340,000 | 7,009,847 | 0.12% | 26,407,463 | 5,068,611 | 0.09% | 38% |
| Total | 2,987,380,000 | 576,213,304 | 9.77% | 2,808,921,718 | 539,140,445 | 9.14% | 7% | |
| Source: Polish Press Agency (PAP) | ||||||||
Investor relations
Investor relations is an increasingly prominent area of business activities. Its importance reflects the rapid growth of the Polish capital market evidenced by the growing value of assets held by investment funds as well as the rising number of publicly-traded companies, which now number more than 400 on the Warsaw Stock Exchange. There are almost 1.5 m investment accounts registered in Poland, including a dynamic group of retail investors who invest their capital through the Warsaw Stock Exchange. The importance of investor relations also follows from increasing legal and regulatory requirements imposed on companies by the legislator, and also by the market itself striving for self-regulation. One fact worth noting is the growing awareness on the part issuers themselves. Well-managed investor relations support their financial strategies and foster a good image, which goes to reinforce their competitive advantage.
In 2013, PGNiG released 207 reports, both periodic and current. The full set of reports required by stock exchange regulations and current information on the PGNiG Group is available at www.pgnig.pl, in the Investor Relations section. The section also contains an investor presentation, providing a valuable insight into and overview of the Group’s position and operations. 2014 will see a revamp of our website to better suit investor needs.
