Key figures of the PGNiG Group
|
[PLN m]
|
2014
|
2013
|
2012
|
2011
|
2010
|
2009
|
|
Sales revenue
|
34,304
|
32,044
|
28,730
|
23,004
|
21,281
|
19,332
|
|
EBIT
|
3,843
|
3,149
|
2,533
|
1,686
|
2,887
|
1,375
|
|
EBIT margin
|
11.2%
|
9.8%
|
8.8%
|
7.3%
|
13.6%
|
7.1%
|
|
EBITDA
|
6,345
|
5,612
|
4,602
|
3,260
|
4,411
|
2,871
|
|
EBITDA margin
|
18.5%
|
17.5%
|
16.0%
|
14.2%
|
20.7%
|
14.9%
|
|
Net profit
|
2,822
|
1,920
|
2,234
|
1,626
|
2,457
|
1,237
|
|
[PLN m]
|
2014
|
2013
|
2012
|
2011
|
2010
|
2009
|
|
Assets
|
48,926
|
48,384
|
47,917
|
37,964
|
33,642
|
31,074
|
|
Equity
|
30,169
|
28,453
|
27,247
|
24,497
|
23,519
|
21,435
|
|
Net debt
|
2,880
|
4,834
|
8,263
|
3,494
|
826
|
832
|
|
PLN
|
2014
|
2013
|
2012
|
2011
|
2010
|
2009
|
|
EPS
|
0.48
|
0.33
|
0.38
|
0.28
|
0.42
|
0.21
|
|
DPS
|
0.20
|
0.15
|
0.13
|
0.00
|
0.12
|
0.08
|
|
[EUR m1]
|
2014
|
2013
|
2012
|
2011
|
2010
|
2009
|
|
Sales revenue
|
8,188
|
7,610
|
6,884
|
5,556
|
5,314
|
4,454
|
|
EBIT
|
917
|
748
|
607
|
407
|
721
|
317
|
|
EBIT margin
|
11.2%
|
9.8%
|
8.8%
|
7.3%
|
13.6%
|
7.1%
|
|
EBITDA
|
1,515
|
1,333
|
1,103
|
787
|
1,102
|
661
|
|
EBITDA margin
|
18.5%
|
17.5%
|
16.0%
|
14.2%
|
20.7%
|
14.9%
|
|
Net profit
|
674
|
456
|
535
|
393
|
614
|
285
|
|
[EUR m2]
|
2014
|
2013
|
2012
|
2011
|
2010
|
2009
|
|
Assets
|
11,479
|
11,667
|
11,721
|
8,595
|
8,495
|
7,564
|
|
Equity
|
7,078
|
6,861
|
6,665
|
5,546
|
5,939
|
5,218
|
|
Net debt
|
676
|
1,166
|
2,021
|
791
|
209
|
202
|
| [EUR1] |
2014 |
2013 |
2012 |
2011 |
2010 |
2009 |
|
EPS
|
0,11
|
0,08
|
0,09
|
0,07
|
0,10
|
0,05
|
|
DPS
|
0,05
|
0,04
|
0,03
|
0,00
|
0,03
|
0,02
|
1 average exchange rate EUR/PLN – 2009 (4.3406); 2010 (4.0044); 2011 (4.1401); 2012 (4.1736); 2013 (4.2110); 2014 (4.1893).
2 EUR/PLN exchange rate as at the end of the period – 2009 (4.1082); 2010 (3.9603); 2011 (4.4168); 2012 (4.0882); 2013 (4.1472); 2014 (4.2623).
Ratios
|
Financial ratios
|
2014
|
2013
|
2012
|
2011
|
2010
|
2009
|
|
ROE
|
9.4%
|
6.7%
|
8.2%
|
6.6%
|
10.4%
|
5.8%
|
|
ROA
|
5.8%
|
4.0%
|
4.7%
|
4.3%
|
7.2%
|
4.0%
|
|
Current ratio
|
1.8
|
1.4
|
1.1
|
1.0
|
1.2
|
1.1
|
|
Quick ratio
|
1.3
|
1.0
|
0.8
|
0.7
|
1.0
|
0.9
|
|
Debt to liabilities
|
38.3%
|
41.2%
|
43.1%
|
35.5%
|
30.1%
|
31.0%
|
|
Debt to equity
|
62.2%
|
70.0%
|
75.9%
|
55.0%
|
43.0%
|
45.0%
|
Employment
|
Employment at the end of the period by segment [persons]
|
2014
|
2013
|
2012
|
2011
|
2010
|
2009
|
|
Exploration and Production
|
10,221
|
10,754
|
10,990
|
12,054
|
11,592
|
10,800
|
|
Trade and Storage
|
3,929
|
4,070
|
3,780
|
3,841
|
4,947
|
4,961
|
|
Distribution
|
12,173
|
13,050
|
13,255
|
13,865
|
13,881
|
13,851
|
|
Generation
|
1,068
|
1,066
|
1,069
|
-
|
-
|
-
|
|
Other
|
1,605
|
1,990
|
2,327
|
2,185
|
2,296
|
2,073
|
|
Total employment
|
28,996
|
30,930
|
31,421
|
31,945
|
32,716
|
31,685
|
Share data
|
Share indicators based on year end share price
|
2014
|
2013
|
2012
|
2011
|
2010
|
2009
|
|
Price/Earnings
|
9.3
|
15.6
|
13.7
|
14.6
|
8.5
|
18.0
|
|
Price/Book Value
|
0.9
|
1.1
|
1.1
|
0.9
|
0.9
|
1.0
|
|
Price/Cash Flow
|
4.9
|
6.9
|
7.1
|
7.5
|
5.3
|
8.2
|
|
EV/EBITDA
|
4.6
|
6.3
|
8.5
|
8.5
|
5.0
|
8.1
|
|
No. of shares (million)
|
5,900
|
5,900
|
5,900
|
5,900
|
5,900
|
5,900
|
|
DPS
|
0.20
|
0.15
|
0.13
|
0.00
|
0.12
|
0.08
|
|
EPS
|
0.48
|
0.33
|
0.38
|
0.28
|
0.42
|
0.21
|
|
High1
|
5.33
|
6.55
|
5.21
|
4.64
|
3.91
|
4.57
|
|
Low2
|
4.17
|
5.14
|
3.62
|
3.45
|
3.16
|
3.24
|
|
Year end share price
|
4.45
|
5.15
|
5.21
|
4.08
|
3.57
|
3.79
|
|
Yearly average share price
|
4.85
|
5.83
|
4.06
|
3.97
|
3.57
|
3.79
|
|
Dividend yield3
|
4.12%
|
2.57%
|
3.20%
|
-
|
3.36%
|
2.11%
|
|
[PLN m]
|
2014
|
2013
|
2012
|
2011
|
2010
|
2009
|
|
Year end market cap
|
26,255
|
30,385
|
30,739
|
24,072
|
21,063
|
22,361
|
|
Capitalization based on yearly average price
|
28,615
|
34,397
|
23,954
|
23,423
|
21,063
|
22,361
|
|
Year high market cap1
|
31,447
|
38,645
|
30,739
|
27,376
|
23,069
|
26,963
|
|
Year low market cap2
|
24,603
|
30,326
|
21,358
|
20,355
|
18,644
|
19,116
|
1 30/07/2009; 12/11/2010; 07/07/2011; 28/12/2012; 07/08/2013; 23/07/2014
2 17/02/2009; 20/05/2010; 14/01/2011; 27/02/2012; 27/12/2013; 24/03/2014
3 dividend yield = annual dividend per share/ yearly average share price.
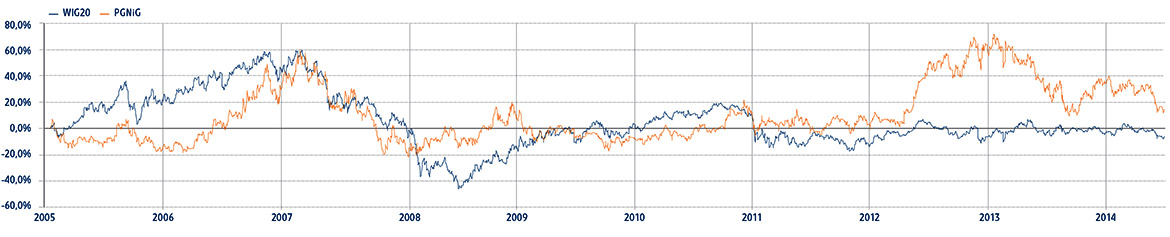
Fluctuations in share price and structure of shareholders
|
Share price fluctuations
|
2014
|
2013
|
2012
|
2011
|
2010
|
2009
|
|
State Treasury
|
72.40%
|
72.40%
|
72.40%
|
72.41%
|
72.44%
|
72.94%
|
|
Others
|
27.60%
|
27.60%
|
27.60%
|
27.59%
|
27.56%
|
27.06%
|
Consolidated income statement
|
[PLN m]
|
2014
|
2013
|
2012
|
2011
|
2010
|
2009
|
|
Sales revenue
|
34,304
|
32,044
|
28,730
|
23,004
|
21,281
|
19,332
|
|
Total operating expenses, including:
|
-30,461
|
-28,895
|
-26,197
|
-21,318
|
-18,394
|
-17,957
|
|
Raw and other materials used
|
-21,229
|
-19,873
|
-17,447
|
-14,059
|
-11,675
|
-11,523
|
|
Employee benefits
|
-2,827
|
-3,214
|
-3,054
|
-2,809
|
-2,647
|
-2,454
|
|
External services
|
-2,843
|
-2,808
|
-3,060
|
-3,241
|
-3,149
|
-2,964
|
|
Operating profit
|
3,843
|
3,149
|
2,533
|
1,686
|
2,887
|
1,375
|
|
Financial income
|
86
|
69
|
216
|
136
|
81
|
203
|
|
Financial expenses
|
-432
|
-465
|
-380
|
-152
|
-30
|
-95
|
|
Share of profits of associated companies
|
129
|
-44
|
173
|
43
|
-1
|
-0
|
|
Pre-tax profit
|
3,626
|
2,709
|
2,542
|
1,712
|
2,936
|
1,483
|
|
Corporate income tax
|
-804
|
-789
|
-308
|
-87
|
-479
|
-246
|
|
Net profit
|
2,822
|
1,920
|
2,234
|
1,626
|
2,457
|
1,237
|
|
Attributable to equity holders of the parent company
|
2,823
|
1,918
|
2,236
|
1,627
|
2,454
|
1,235
|
|
Attributable to minority interests
|
-1
|
2
|
-2
|
-1
|
3
|
2
|
Consolidated statement of financial position
|
Assets [PLN m]
|
2014
|
2013
|
2012
|
2011
|
2010
|
2009
|
|
Non-current assets, including
|
37,692
|
37,479
|
37,084
|
30,435
|
27,433
|
24,658
|
|
Property, plant and equipment
|
33,528
|
33,033
|
33,784
|
28,427
|
25,662
|
22,889
|
|
Investments in associates undertakings valued with equity method
|
856
|
727
|
771
|
598
|
556
|
557
|
|
Current assets, including
|
11,234
|
10,905
|
10,833
|
7,529
|
6,210
|
6,417
|
|
Inventories
|
3,189
|
3,378
|
3,064
|
2,082
|
1,050
|
1,259
|
|
Trade and other receivables
|
4,236
|
4,086
|
5,374
|
3,378
|
3,387
|
3,680
|
|
Cash and cash equivalents
|
2,958
|
2,827
|
1,948
|
1,505
|
1,373
|
1,196
|
|
Total assets
|
48,926
|
48,384
|
47,917
|
37,964
|
33,643
|
31,074
|
|
Equity and liabilities [PLN m]
|
2014
|
2013
|
2012
|
2011
|
2010
|
2009
|
|
Total equity, including
|
30,169
|
28,453
|
27,247
|
24,497
|
23,519
|
21,435
|
|
Share capital
|
5,900
|
5,900
|
5,900
|
5,900
|
5,900
|
5,900
|
|
Retained earnings
|
22,794
|
20,856
|
19,693
|
2,723
|
3,655
|
2,380
|
|
Equity attributable to minority interests
|
5
|
6
|
4
|
7
|
13
|
10
|
|
Total liabilities
|
18,757
|
19,931
|
20,670
|
13,468
|
10,123
|
9,639
|
|
Total long-term liabilities, including
|
12,384
|
12,093
|
11,057
|
5,622
|
4,973
|
3,740
|
|
Loans, borrowings and debt securities
|
5,069
|
5,385
|
5,509
|
1,382
|
970
|
44
|
|
Total short-term liabilities, including
|
6,373
|
7,838
|
9,613
|
7,846
|
5,150
|
5,899
|
|
Loans, borrowings and debt securities
|
769
|
2,276
|
4,702
|
3,617
|
1,229
|
1,984
|
|
Total equity and liabilities
|
48,926
|
48,384
|
47,917
|
37,965
|
33,643
|
31,074
|
Consolidated cash flow statement
|
[PLN m]
|
2014
|
2013
|
2012
|
2011
|
2010
|
2009
|
|
Net cash from operating activities, including
|
6,979
|
7,813
|
2,552
|
2,468
|
3,843
|
2,555
|
|
Net profit
|
2,822
|
1,920
|
2,234
|
1,626
|
2,457
|
1,237
|
|
Depreciation and amortization
|
2,502
|
2,463
|
2,069
|
1,574
|
1,525
|
1,496
|
|
Profit (loss) on investing activities
|
739
|
568
|
138
|
86
|
-346
|
-212
|
|
Income tax paid
|
-677
|
-495
|
-591
|
-396
|
-216
|
-556
|
|
Change in receivables, net
|
-128
|
1,310
|
-1,734
|
12
|
-361
|
62
|
|
Change in inventories
|
189
|
-321
|
-620
|
-1,031
|
217
|
462
|
|
Change in current liabilities
|
-477
|
394
|
248
|
315
|
239
|
-571
|
|
Net cash from investment activities
|
-3,680
|
-3,060
|
-6,149
|
-4,019
|
-3,559
|
-3,638
|
|
Net cash from financial activities
|
-3,169
|
-3,874
|
4,040
|
1,682
|
-108
|
858
|
|
Cash and cash equivalents at the end of the period
|
2,956
|
2,826
|
1,947
|
1,504
|
1,373
|
1,196
|
Revenue from sales of products, services, goods for resale and materials
|
Revenue from sales of products1 [PLN m]
|
2014
|
2013
|
2012
|
2011
|
2010
|
2009
|
|
High-methane gas
|
25,726
|
23,540
|
22,309
|
19,014
|
17,888
|
16,208
|
|
Low-methane gas
|
1,402
|
1,430
|
1,389
|
1,217
|
1,187
|
1,281
|
|
Crude oil, condensate and NGLs
|
2,654
|
2,757
|
1,263
|
1,100
|
842
|
664
|
|
Helium
|
120
|
183
|
161
|
58
|
44
|
37
|
|
Electricity
|
1,695
|
1,360
|
842
|
11
|
-
|
-
|
|
Heat
|
1,079
|
1,069
|
978
|
-
|
-
|
-
|
|
Geophysical and geological services
|
281
|
239
|
329
|
448
|
279
|
226
|
|
Exploration services
|
480
|
594
|
586
|
578
|
408
|
377
|
|
Other sales
|
620
|
519
|
874
|
578
|
633
|
538
|
|
Total sales revenue
|
34,057
|
32,120
|
28,730
|
23,004
|
21,281
|
19,332
|
1 Data includes both domestic and export sales.
Operating expenses
|
[PLN m]
|
2014
|
2013
|
2012
|
2011
|
2010
|
2009
|
|
Raw and other materials used
|
-21,229
|
-19,873
|
-17,447
|
-14,059
|
-11,675
|
-11,523
|
|
Employee benefits
|
-2,827
|
-3,214
|
-3,054
|
-2,809
|
-2,647
|
-2,454
|
|
Depreciation and amortization
|
-2,502
|
-2,463
|
-2,069
|
-1,574
|
-1,525
|
-1,496
|
|
Contracted services
|
-2,843
|
-2,808
|
-3,060
|
-3,241
|
-3,149
|
-2,964
|
|
Cost of products and services for internal purposes
|
980
|
983
|
1,006
|
1,001
|
1,043
|
900
|
|
Other operating expenses, net
|
-2,040
|
-1,520
|
-1,573
|
-637
|
-442
|
-420
|
|
Total operating expenses
|
-30,461
|
-28,895
|
-26,197
|
-21,318
|
-18,394
|
-17,957
|
|
Raw and other materials used [PLN m]
|
2014
|
2013
|
2012
|
2011
|
2010
|
2009
|
|
Cost of gas sold
|
-18,750
|
-17,569
|
-15,714
|
-13,353
|
-11,005
|
-10,862
|
|
Fuels for electricity and heat generation
|
-760
|
-908
|
-984
|
-
|
-
|
-
|
|
Electricity for trading
|
-1,093
|
-670
|
-
|
-
|
-
|
-
|
|
Other raw and other materials used
|
-626
|
-726
|
-749
|
-706
|
-670
|
-661
|
|
Contracted services [PLN m]
|
2014
|
2013
|
2012
|
2011
|
2010
|
2009
|
|
Purchases of transmission services from GTO Gaz-System SA
|
-1,076
|
-1,113
|
-1,454
|
-1,463
|
-1,531
|
-1,354
|
|
Costs of written off dry wells
|
-282
|
-132
|
-127
|
-276
|
-162
|
-265
|
|
Other contracted services
|
-1,485
|
-1,563
|
-1,479
|
-1,502
|
-1,455
|
-1,449
|
Operating segments
Exploration and Production. The segment supplies gas and oil, as well as providing geophysical and exploration services. The operations within this segment comprise the entire process of gas and crude oil production: from geophysical testing before exploration, to extraction and preparation of the product for sale.
Trade and Storage. This segment is responsible for gas purchased by the Company, tariff-based gas sales and storage activity, as well as electricity trading.
Distribution. This segment deals with gas distribution to end customers, primarily retail customers, as well as the operation, maintenance and expansion of the distribution system.
Generation. The segment’s activities involve the generation of electricity and heat.
Other operations. This segment provides engineering services and manufactures machinery for facilities and units used in oil mining and gas engineering.
EBIT of separate operating segments [PLN m]
* Distribution System Operators (currently Gas Companies) tested their non-current assets for impairment on 31 December 2007. The analyses prepared by these companies showed that the book value of assets is higher than their current realizable value. The PLN 1,317m write-off was reversed in 2009-2010 after a significant improvement in the profitability of the Distribution segment.
|
Exploration and Production [PLN m]
|
2014
|
2013
|
2012
|
2011
|
2010
|
2009
|
|
Total segment revenue
|
6,071
|
6,185
|
4,325
|
4,081
|
3,452
|
3,201
|
|
Total segment costs
|
-4,065
|
-3,854
|
-2,972
|
-2,954
|
-2,864
|
-2,865
|
|
Operating result
|
2,006
|
2,331
|
1,353
|
1,126
|
588
|
337
|
|
Segment assets
|
15,442
|
15,364
|
16,580
|
14,923
|
12,797
|
11,063
|
|
Segment liabilities
|
5,531
|
4,954
|
5,823
|
2,177
|
1,863
|
1,608
|
|
Capital expenditure
|
-2,063
|
-1,630
|
-1,676
|
-2,537
|
-2,193
|
-1,913
|
|
Trade and Storage [PLN m]
|
2014
|
2013
|
2012
|
2011
|
2010
|
2009
|
|
Total segment revenue
|
28,825
|
25,659
|
23,713
|
20,045
|
19,080
|
17,371
|
|
Total segment costs
|
-28,242
|
-25,667
|
-23,388
|
-20,229
|
-18,264
|
-17,421
|
|
Operating result
|
583
|
-8
|
325
|
-184
|
815
|
-50
|
|
Segment assets
|
18,299
|
17,344
|
18,650
|
12,117
|
10,447
|
10,201
|
|
Segment liabilities
|
4,873
|
4,634
|
3,937
|
2,774
|
3,536
|
2,921
|
|
Capital expenditure
|
-269
|
-341
|
-719
|
-619
|
-506
|
-780
|
|
Distribution [PLN m]
|
2014
|
2013
|
2012
|
2011
|
2010
|
2009
|
|
Total segment revenue
|
4,283
|
4,250
|
3,583
|
3,471
|
3,538
|
3,040
|
|
Total segment costs
|
-3,145
|
-3,511
|
-2,705
|
-2,687
|
-2,047
|
-1,995
|
|
Operating result
|
1,138
|
739
|
878
|
784
|
1,491
|
1,045
|
|
Segment assets
|
14,142
|
14,067
|
13,089
|
12,420
|
12,228
|
11,039
|
|
Segment liabilities
|
2,638
|
2,879
|
2,234
|
1,915
|
1,932
|
1,872
|
|
Capital expenditure
|
-1,091
|
-1,110
|
-1,141
|
-1,125
|
-958
|
-1,127
|
|
Generation [PLN m]
|
2014
|
2013
|
2012
|
2011
|
2010
|
2009
|
|
Total segment revenue
|
1,943
|
2,063
|
1,957
|
-
|
-
|
-
|
|
Total segment costs
|
-1,781
|
-1,919
|
-1,942
|
-
|
-
|
-
|
|
Operating result
|
162
|
144
|
15
|
-
|
-
|
-
|
|
Segment assets
|
4,184
|
4,124
|
4,345
|
-
|
-
|
-
|
|
Segment liabilities
|
2,049
|
1,943
|
2,870
|
-
|
-
|
-
|
|
Capital expenditure
|
-285
|
-203
|
-196
|
-
|
-
|
-
|
|
Other operations [PLN m]
|
2014
|
2013
|
2012
|
2011
|
2010
|
2009
|
|
Total segment revenue
|
325
|
424
|
543
|
504
|
568
|
461
|
|
Total segment costs
|
-393
|
-489
|
-563
|
-509
|
-541
|
-439
|
|
Operating result
|
-68
|
-65
|
-20
|
-4
|
27
|
21
|
|
Segment assets
|
387
|
411
|
483
|
490
|
415
|
366
|
|
Segment liabilities
|
219
|
187
|
171
|
95
|
131
|
136
|
|
Capital expenditure
|
-10
|
-13
|
-29
|
-17
|
-13
|
-20
|
Production of gas, crude oil and other products
|
Natural gas [million m³]
|
2014
|
2013
|
2012
|
2011
|
2010
|
2009
|
|
High-methane gas
|
1,876
|
1,890
|
1,608
|
1,615
|
1,612
|
1,637
|
|
Low-methane gas1
|
2,627
|
2,692
|
2,710
|
2,714
|
2,609
|
2,468
|
|
Total natural gas
|
4,503
|
4,582
|
4,317
|
4,329
|
4,220
|
4,105
|
|
Crude oil, condensate and NGLs [ths tonnes]
|
2014
|
2013
|
2012
|
2011
|
2010
|
2009
|
|
Crude oil, condensate and NGLs
|
1,207
|
1,098
|
492
|
468
|
501
|
504
|
|
Total natural gas, crude oil, condensate and NGLs [m boe]
|
38
|
38
|
31
|
31
|
31
|
30
|
|
Other products [ths tonnes]
|
2014
|
2013
|
2012
|
2011
|
2010
|
2009
|
|
Propane-butane gas
|
32
|
30
|
23
|
21
|
21
|
20
|
|
Sulphur
|
41
|
39
|
25
|
24
|
25
|
25
|
|
LNG
|
30
|
32
|
28
|
23
|
27
|
20
|
|
Other products [million m³]
|
2014
|
2013
|
2012
|
2011
|
2010
|
2009
|
|
Helium
|
3
|
3
|
3
|
3
|
3
|
2
|
1 High-methane gas equivalent in normal conditions
Reserves of gas and crude oil
|
Natural gas [m boe]
|
2014
|
2013
|
2012
|
2011
|
2010
|
2009
|
|
Poland
|
527
|
550
|
579
|
589
|
592
|
608
|
|
Norway
|
43
|
40
|
43
|
43
|
35
|
36
|
|
Pakistan
|
53
|
53
|
53
|
53
|
53
|
29
|
|
Total
|
622
|
643
|
675
|
685
|
680
|
673
|
|
Crude oil, condensate and NGLs [m boe]
|
2014
|
2013
|
2012
|
2011
|
2010
|
2009
|
|
Poland
|
136
|
141
|
146
|
149
|
151
|
147
|
|
Norway
|
38
|
21
|
26
|
26
|
23
|
23
|
|
Total
|
174
|
162
|
172
|
175
|
174
|
170
|
Natural gas and crude oil sales volume
|
[million m3]
|
2014
|
2013
|
2012
|
2011
|
2010
|
2009
|
|
Natural gas
|
18,602
|
16,208
|
14,913
|
14,277
|
14,417
|
13,284
|
|
[ths tonnes]
|
2014
|
2013
|
2012
|
2011
|
2010
|
2009
|
|
Crude oil, condensate and NGLs
|
1,169
|
1,106
|
485
|
467
|
500
|
506
|
Volume of gas sales in 2013-2014 by customer group (billion m3)
Underground gas storage facilities
|
Current and target capacity of underground gas storage facilities [million m3]
|
|
Name
|
Type of investment
|
Working capacity
|
Target working capacity
|
Estimated completion
|
|
Underground gas storage facilities for high-methane gas
|
|
|
|
|
|
Wierzchowice
|
|
1,200
|
1,200
|
|
|
Husów
|
|
500
|
500
|
|
|
Mogilno
|
extension
|
408
|
800
|
2024
|
|
Strachocina
|
|
360
|
360
|
|
|
Swarzów
|
|
90
|
90
|
|
|
Brzeźnica
|
extension
|
65
|
100
|
2016
|
|
Kosakowo
|
extension
|
119
|
250
|
2021
|
|
Underground gas storage facilities for low-methane gas
|
|
|
|
|
|
Bonikowo
|
|
200
|
200
|
|
|
Daszewo
|
|
30
|
30
|
|
|
Total
|
|
2,972
|
3,530
|
|
Sources of natural gas
|
[million m³]
|
2014
|
2013
|
2012
|
2011
|
2010
|
2009
|
|
Domestic production
|
4,027
|
4,211
|
4,317
|
4,329
|
4,220
|
4,105
|
|
Imports
|
9,700
|
10,850
|
11,001
|
10,915
|
10,066
|
9,136
|
|
From the East
|
8,097
|
8,733
|
9,018
|
9,336
|
9,034
|
8,142
|
|
From the West
|
1,225
|
1,564
|
1,427
|
1,370
|
1,032
|
993
|
|
From the North
|
-
|
-
|
-
|
-
|
-
|
-
|
|
From the South
|
378
|
553
|
556
|
209
|
-
|
-
|
|
Total
|
13,726
|
15,061
|
15,318
|
15,245
|
14,287
|
13,241
|
Exchange rates
|
Yearly average exchange rate
|
2014
|
2013
|
2012
|
2011
|
2010
|
2009
|
|
USD/PLN
|
3.1774
|
3.1658
|
3.2304
|
2.9636
|
3.0179
|
3.1162
|
|
EUR/PLN
|
4.1893
|
4.2110
|
4.1736
|
4.1401
|
4.0044
|
4.3406
|
|
Exchange rate at the end of the period
|
2014
|
2013
|
2012
|
2011
|
2010
|
2009
|
|
USD/PLN
|
3.5073
|
3.0120
|
3.0996
|
3.4174
|
2.9641
|
2.8503
|
|
EUR/PLN
|
4.2623
|
4.1472
|
4.0882
|
4.4168
|
3.9603
|
4.1082
|
Source: National Bank of Poland.
Average prices of crude oil
|
USD/bbl
|
Q1
|
Q2
|
Q3
|
Q4
|
Q1–4
|
|
2009
|
45.04
|
59.28
|
68.25
|
74.93
|
62.04
|
|
2010
|
76.78
|
78.63
|
76.41
|
86.93
|
79.73
|
|
2011
|
105.21
|
116.80
|
112.90
|
109.31
|
111.05
|
|
2012
|
118.71
|
108.73
|
109.90
|
110.49
|
111.96
|
|
2013
|
112.83
|
103.00
|
110.04
|
109.40
|
108.82
|
|
2014
|
107.86
|
109.70
|
102.15
|
76.11
|
98.96
|
Source: Bloomberg, European Dated Brent Forties Oseberg (BFO).
Conversion rates
| |
1 bn m3
of natural gas |
1 bn cf
of natural gas
|
1 m tonnes
of crude oil
|
1 m tonnes
of LNG
|
1 m tonnes
of bituminous coal
|
1 x 10¹² Btu
|
1 PJ
|
1 m boe
|
1 TWh
|
|
1 bn m3 of natural gas
|
1
|
35.3
|
0.90
|
0.73
|
1.35
|
36
|
38
|
6.45
|
10.97
|
|
1 bn cf of natural gas
|
0.028
|
1
|
0.026
|
0.021
|
0.038
|
1.03
|
1.08
|
0.18
|
0.29
|
1 m tonnes
of crude oil
|
1.113
|
39.2
|
1
|
0.81
|
1.52
|
40.4
|
42.7
|
7.33
|
11.65
|
1 m tonnes
of LNG
|
1.38
|
48.7
|
1.23
|
1
|
1.86
|
52
|
55
|
8.68
|
14.34
|
|
1 m tonnes of bituminous coal
|
0.74
|
26.1
|
0.66
|
0.54
|
1
|
26.7
|
28.1
|
4.66
|
8.14
|
|
1 x 10¹² Btu
|
0.028
|
0.98
|
0.025
|
0.02
|
0.038
|
1
|
1.06
|
0.17
|
0.29
|
|
1 PJ
|
0.026
|
0.93
|
0.23
|
0.019
|
0.036
|
0.95
|
1
|
0.17
|
0.28
|
|
1 m boe
|
0.16
|
5.61
|
0.14
|
0.12
|
0.21
|
5.8
|
6.04
|
1
|
1.70
|
|
1 TWh
|
0.091
|
3.41
|
0.086
|
0.07
|
0.123
|
3.41
|
3.6
|
0.59
|
1
|
Definitions
|
|
boe
|
barrel of oil equivalent (1 barrel equals approx. 0.136 tonnes)
|
|
Btu
|
British thermal units; amount of heat required to raise the temperature of one pound of liquid water by one degree Fahrenheit
|
|
cf
|
standard cubic feet
|
Financial calendar
| |
Publications dates |
|
Annual statement - 2014
|
5 March 2015
|
|
Quarterly consolidated report - Q1 2015
|
8 May 2015
|
|
Half-yearly consolidated report - H1 2015
|
14 August 2015
|
|
Quarterly consolidated report - Q3 2015
|
6 November 2015
|
PGNiG provides a webcast of press conferences on the results at www.pgnig.pl in Polish and English.
Mailing list
PGNiG Investor Mailing List is a mailing service for use by shareholders, analysts and anyone who is interested in the PGNiG Group. This service provides the latest news on PGNiG, financial reports and other information via e-mail. If you would like to be added to our list, please send a request to ri@pgnig.pl.